What signal strength really means
Wi-Fi signal is measured in dBm and is always negative. What -60 and -75 feel like in real use, why bars mislead, and where to see the real number.
Your laptop shows three bars out of four and the video call freezes anyway. Your phone, sitting on the same table with two bars, streams happily through the whole thing. The bars are not exactly lying, but they are not telling you much either.
Why the number is negative
Wi-Fi signal strength is measured in dBm. The numbers look wrong the first time you see them: -45, -67, -82. All negative, and the one closest to zero is the best.
Here is why. The signal arriving at your phone is extremely faint, a small fraction of a thousandth of a watt. Written as an ordinary number, that is a string of zeros after the decimal point. dBm is a compressed scale that describes how far below one milliwatt a signal sits. Everything Wi-Fi does is below that, so every number comes out negative. That is all the minus sign means.
-45 dBm is stronger than -70 dBm. Closer to zero is better. If you remember only that, you can read any signal reading you meet.
What each level actually feels like
| Reading | In plain words | What to expect |
|---|---|---|
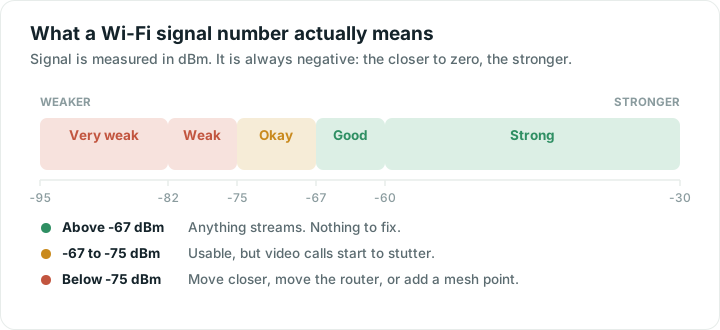
| -30 to -60 dBm | Strong | Full speed. Nothing to fix. |
| -60 to -67 dBm | Good | Comfortable for streaming and video calls. |
| -67 to -75 dBm | Okay | Browsing is fine. Calls and 4K start to stutter. |
| -75 to -85 dBm | Weak | Slow, with dropouts. |
| Below -85 dBm | Very weak | Barely usable. |
The line that matters most sits around -67 dBm. Network engineers commonly treat that as the floor for a reliable video call. Above it, things generally just work. Below it, your device starts spending its effort on retries rather than on your data.
These bands are conventions, not laws of physics. A -70 dBm connection on an empty channel can beat a -60 dBm one in a crowded block of flats.
Why 10 dB is a bigger deal than it looks
The dBm scale is logarithmic, so the gaps are not what they appear.
- Every 3 dB is roughly half or double the power.
- Every 10 dB is a factor of ten.
Going from -60 to -70 dBm is not a small percentage drop. The signal reaching your device is about a tenth as strong. This is why a single brick wall can change everything, and why one more room away so often falls off a cliff rather than sloping gently downwards.
Why bars mislead
Bars are a translation of dBm into a picture, and every manufacturer translates differently. One phone shows three bars at -70 dBm, another shows two, a laptop shows four. There is no standard.
Bars also change slowly and round aggressively. A single bar on the icon can cover a range wide enough to include both flawless and struggling, and it will sit there unchanged while your connection quietly degrades.
They are not useless. They are a rough summary, fine for answering "am I in range". For comparing two spots in your home, or checking whether moving the router helped, you want the number.
Where to see the number
- Android. Tap your network in Wi-Fi settings for a signal rating. Many phones hide the raw dBm, which is why analyzer apps exist.
- Mac. Hold Option and click the Wi-Fi icon in the menu bar. The RSSI figure is your dBm.
- Windows.
netsh wlan show interfacesin Command Prompt shows signal as a percentage rather than dBm. - iPhone. You cannot, and it is worth being straight about this. Apple does not give apps access to Wi-Fi signal strength or to scans of nearby networks. No iOS app can show you a dBm reading, whatever its store listing implies. Your router's own app, or a borrowed Android phone, are the realistic options.
On iPhone there is still a useful stand-in: measure how quickly your router replies to small messages and watch that as you walk around. It is not dBm, but a room where replies slow down and go missing is a weak room, and finding that room was the point.
Signal is only half the story
A strong signal means the radio link is healthy. It does not mean your connection is fast or steady. You can sit at -50 dBm and still have a poor time because twelve neighbours share your channel, or because your provider is having a bad evening.
So pair the two. Check the signal in the room that struggles, then run a speed test in that same spot. A strong signal with poor speed points outwards, to congestion or the provider. A weak signal with poor speed points at coverage, which means moving the router, clearing obstacles or adding a mesh point. The tools cover both halves, and why your Wi-Fi is slow works through them in order.
Quick answers
Is -65 dBm a good Wi-Fi signal?
Yes, that is a good signal. Anything from -30 to -67 dBm is comfortable for streaming and video calls. Below -67 dBm you start to see stutters on calls, and below -75 dBm the connection becomes slow and prone to dropouts.
Why is Wi-Fi signal strength a negative number?
Because dBm measures how far below one milliwatt the signal is, and every Wi-Fi signal is far below that. The minus sign carries no bad meaning on its own. The closer the number is to zero, the stronger the signal.
Why do my phone and my laptop show different bars in the same spot?
Because every manufacturer decides for itself how many dBm equals one bar, and the two devices also have different antennas. Bars are a rough summary, not a measurement. Comparing dBm values on the same device is far more reliable.
Can an iPhone app show my Wi-Fi signal in dBm?
No. Apple does not let apps read Wi-Fi signal strength or scan nearby networks, so any app claiming a dBm reading on iOS is not giving you one. Timing how quickly your router replies is the practical alternative for finding weak rooms.